
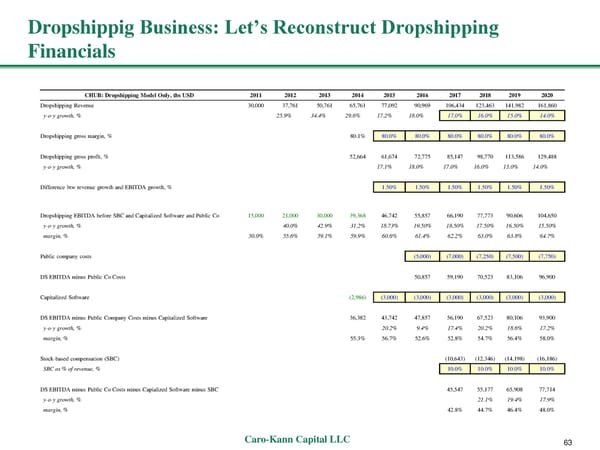
Dropshippig Business: Let’s Reconstruct Dropshipping Financials CHUB: Dropshipping Model Only, ths USD 2011 2012 2013 2014 2015 2016 2017 2018 2019 2020 Dropshipping Revenue 30,000 37,761 50,761 65,761 77,092 90,969 106,434 123,463 141,982 161,860 y-o-y growth, % 25.9% 34.4% 29.6% 17.2% 18.0% 17.0% 16.0% 15.0% 14.0% Dropshipping gross margin, % 80.1% 80.0% 80.0% 80.0% 80.0% 80.0% 80.0% Dropshipping gross profit, % 52,664 61,674 72,775 85,147 98,770 113,586 129,488 y-o-y growth, % 17.1% 18.0% 17.0% 16.0% 15.0% 14.0% Difference btw revenue growth and EBITDA growth, % 1.50% 1.50% 1.50% 1.50% 1.50% 1.50% Dropshipping EBITDA before SBC and Capitalized Software and Public Co 15,000 21,000 30,000 39,368 46,742 55,857 66,190 77,773 90,606 104,650 y-o-y growth, % 40.0% 42.9% 31.2% 18.73% 19.50% 18.50% 17.50% 16.50% 15.50% margin, % 50.0% 55.6% 59.1% 59.9% 60.6% 61.4% 62.2% 63.0% 63.8% 64.7% Public company costs (5,000) (7,000) (7,250) (7,500) (7,750) DS EBITDA minus Public Co Costs 50,857 59,190 70,523 83,106 96,900 Capitalized Software (2,986) (3,000) (3,000) (3,000) (3,000) (3,000) (3,000) DS EBITDA minus Public Company Costs minus Capitalized Software 36,382 43,742 47,857 56,190 67,523 80,106 93,900 y-o-y growth, % 20.2% 9.4% 17.4% 20.2% 18.6% 17.2% margin, % 55.3% 56.7% 52.6% 52.8% 54.7% 56.4% 58.0% Stock-based compensation (SBC) (10,643) (12,346) (14,198) (16,186) SBC as % of revenue, % 10.0% 10.0% 10.0% 10.0% DS EBITDA minus Public Co Costs minus Capialized Software minus SBC 45,547 55,177 65,908 77,714 y-o-y growth, % 21.1% 19.4% 17.9% margin, % 42.8% 44.7% 46.4% 48.0% Caro-Kann Capital LLC 63
 CommerceHub: Uniquely Levered to E-Commerce Growth Page 63 Page 65